Quick Wins To Improve Your Core Web Vitals


Your website’s performance is like that magic ingredient that makes all the difference in user engagement – and getting it right is anything but a secret.
Enter Core Web Vitals – your go-to for measuring your site’s speed, interactivity and visual stability.
These aren’t just abstract numbers – they actually tell you how your users are feeling when they visit your site. By optimising these areas, you can turn your users into raving fans, keep them sticking around longer and boost your Google rankings.
Getting a handle on how to improve core web vitals is quite technical, but there are some simple things you can do to improve the scores.
Making Sense Of Core Web Vitals
What On Earth Are Core Web Vitals?
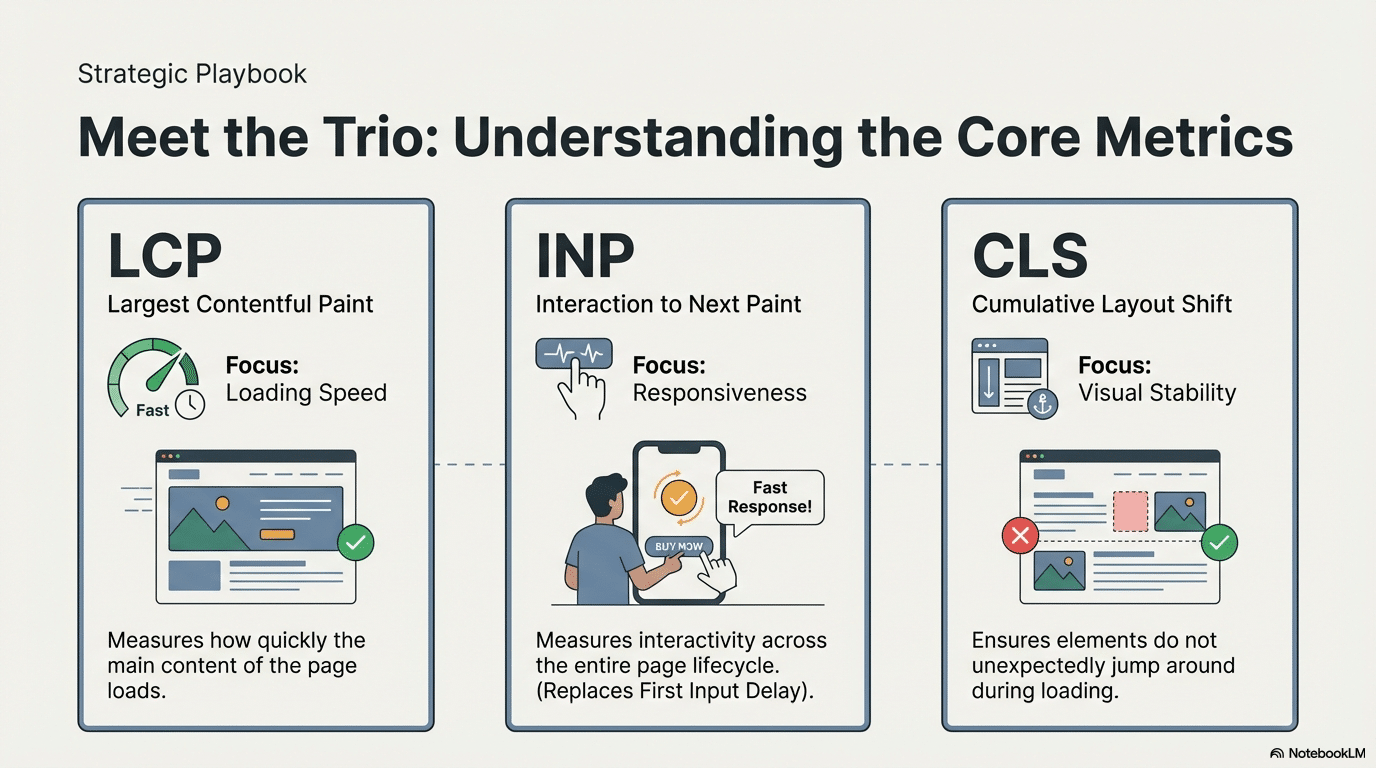
Time to break it down: Core Web Vitals is a trio of user-focused metrics that get to the heart of how fast, responsive and visually stable your site is.
Here’s what each component measures:
- Largest Contentful Paint (LCP): This is how quickly the main content of your page loads. If your LCP score is top-notch, users aren’t left twiddling their thumbs waiting for your site to appear.
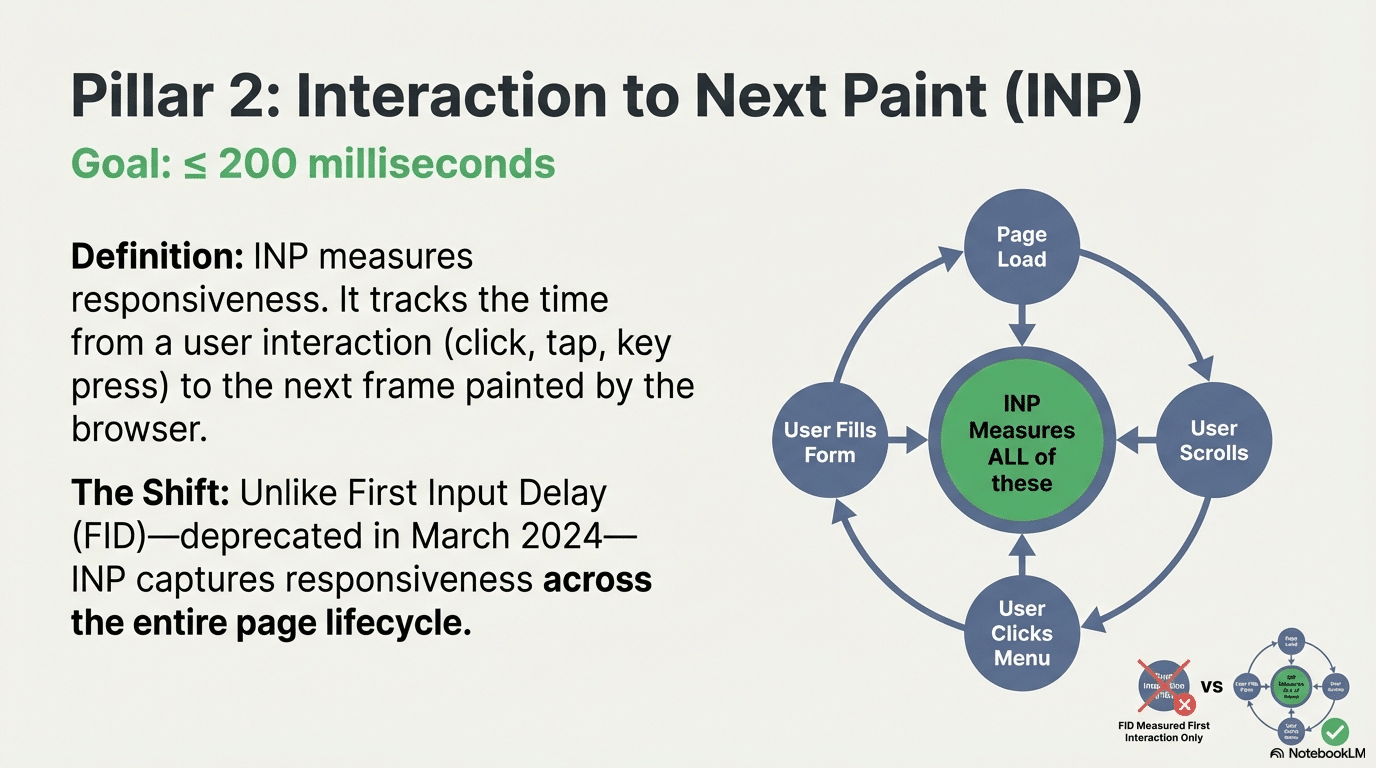
- Interaction to Next Paint (INP): This measures how quickly your site responds to user interactions throughout the entire page lifecycle – not just the first click. Unlike the old First Input Delay (FID) metric that got the chop in March 2024, INP captures the responsiveness of all interactions, giving a complete picture of your site’s interactivity. A good INP score is anything under 200 milliseconds.
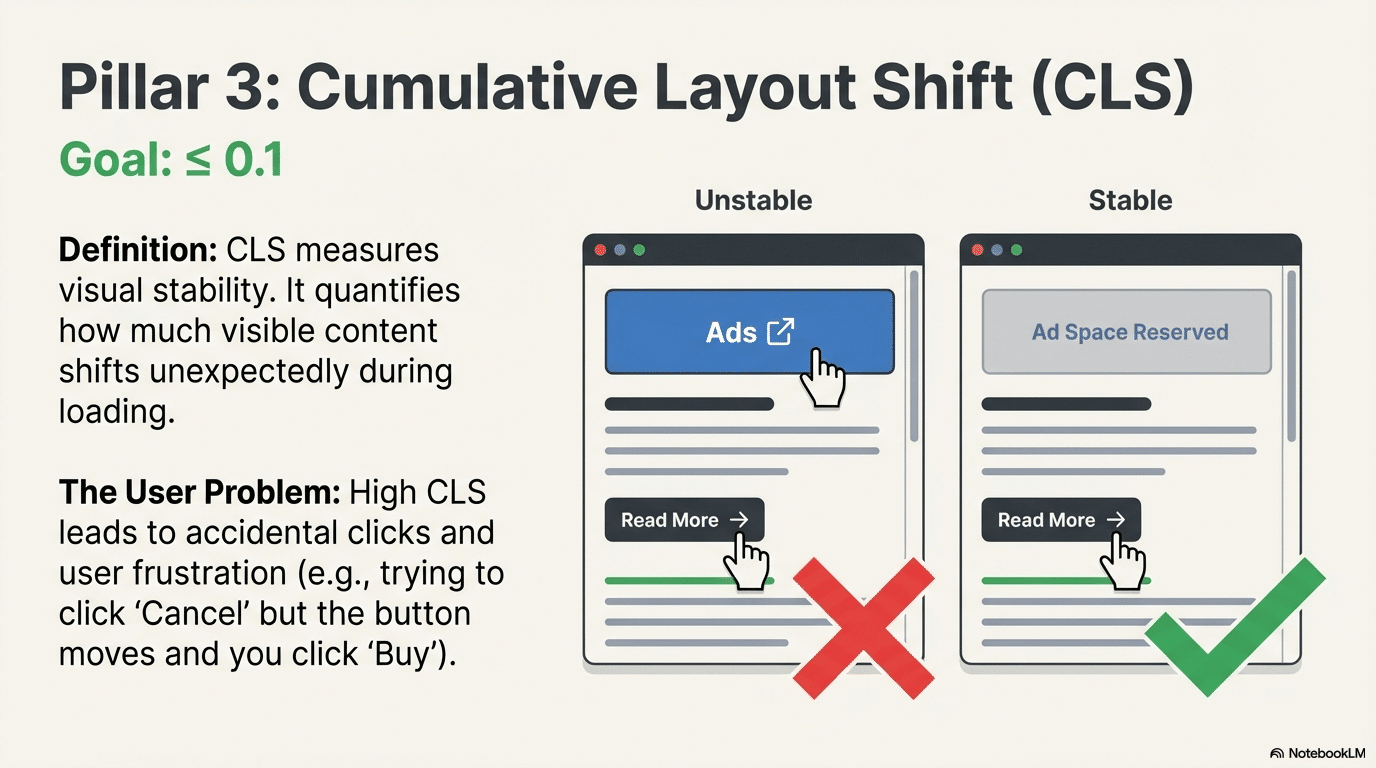
- Cumulative Layout Shift (CLS): This looks at visual stability – ensuring that elements on your page don’t unexpectedly jump around. A low CLS score means fewer accidental clicks and a smoother ride for your users.
The Scoring System
To actually measure your site’s performance, you need to understand Google’s scoring system. These thresholds are based on the 75th percentile of real user data:
| Metric | Good | Needs Improvement | Poor |
| LCP | ≤ 2.5s | 2.5s – 4.0s | > 4.0s |
| INP | ≤ 200ms | 200ms – 500ms | > 500ms |
| CLS | ≤ 0.1 | 0.1 – 0.25 | > 0.25 |
Table 1: Core Web Vitals performance thresholds
Google uses the 75th percentile measurement, meaning your site needs to hit these targets for at least 75% of user visits to be considered “Good”
Why Do Core Web Vitals Matter
Each Core Web Vital plays its on part, and is important for a few simple reasons:
- User Experience: They directly affect how users feel about your site. Faster loading and stable pages make for a more enjoyable and less annoying experience.
- SEO Importance: Google uses these metrics as ranking signals, so improving them can boost your site’s spot in search results. Getting a handle on how to improve core web vitals is key to a winning SEO strategy. It’s not a huge impact, but can be a “last mile” ranking factor.
- Business Impact: Better core web vitals can lead to more visitors and conversions. According to a study by Google, sites that hit the recommended core web vitals benchmarks see a 24% drop in abandonment rates.
These metrics are more than just numbers – they’re a crucial barometer of how well your site caters to its users. By focusing on these areas, businesses can ensure their online presence is both user-friendly and search engine optimised. Plus, regularly checking your core web vitals report in Google Search Console can help identify any core web vitals issues that might be impacting your site’s performance.
Lab Data vs Field Data: Understanding The Difference
Before you start trying to optimise, it’s worth getting your head around how core web vitals are measuredField Data (Real User Monitoring): This stuff comes from actual people visiting your site in the real world. Google collects it through the Chrome User Experience Report (CrUX), which gathers data from real Chrome users over a 28-day rolling window. It’s this real-world data that Google actually uses to decide rankings.
Lab Data (Synthetic Testing): Tools like Lighthouse and PageSpeed Insights are great for simulating page loads in a controlled environment. But, to be honest, lab data doesn’t always reflect real-world performance.
Why both matter: Field data gives you a glimpse into how real users actually experience your site, while lab data helps you identify specific problems. Focus on improving those field data scores, but use lab data to help pinpoint the issues.
How To Improve Core Web Vitals
Before diving into the quick fixes for Core Web Vitals, its worth noting that many of these strategies will also play a major role in improving WordPress SEO. From making your site load faster to giving users a smoother experience, optimising Core Web Vitals can directly boost your WordPress site’s performance and search visibility.
Let’s explore the most effective ways to fine-tune these metrics and see some real results in terms of user satisfaction and SEO.
Quick Wins for Largest Contentful Paint (LCP)
Optimising LCP Improves Page Load Time
Boosting your Largest Contentful Paint is all about improving site speed. Here’s what you need to do to get a better LCP score:
Image Optimisation: Big images are a major speed killer. Compress them and use next-gen formats like WebP or AVIF to cut load times without losing any quality. AVIF offers superior compression compared to WebP and – amazingly – has near-universal browser support. Don’t forget to use srcset and sizes attributes to serve the right image size for different devices.
TinyPNG is a good tool for compression and image compression is an absolute must-do for improving loading performance. Consider using image CDNs like Cloudflare Images, Cloudinary, or Imgix that automatically pick the best format for each visitor’s browser.

Critical: Get Your LCP Image Sorted
- Don’t lazy load your LCP image – it needs to load right away
- Use fetchpriority=”high” on your LCP image to give it priority
- Preload your LCP image. And, yes, this is a thing:
- Serve your LCP images from a CDN for super fast delivery
Server Response Time (TTFB): A slow server can really slow down your site’s biggest elements. Time to First Byte (TTFB) is crucial for good LCP performance. Using a Content Delivery Network (CDN) can spread your content across servers worldwide, cutting down the distance data has to travel and speeding things up. Reduce server response times to get your site loaded quickly.
Some extra server optimisations include:
- Enable gzip or Brotli compression on your server
- Implement server-side caching (Redis, Memcached)
- Use HTTP/2 or HTTP/3 for faster resource loading
- Try to reduce your redirect chains to get rid of those extra round trips
Remove Render-Blocking Resources: CSS and JavaScript files that block page rendering can mess with LCP scores. Minifying these resources ( basically trimming unnecessary characters and spaces ) can shrink file sizes and improve load times. Also, consider deferring non-essential JS to let the vital elements load first.
Some more advanced techniques include:
- Inline critical CSS directly in the HTML head
- Use for critical third-party origins
- Defer non-critical CSS with media queries or JavaScript
- Use resource hints like dns-prefetch and prefetch
Getting these tweaks right can seriously enhance your website’s initial loading performance and leave a lasting impression on both users and search engines. Regularly measuring core web vitals using tools like the Web Vitals Chrome Extension can provide super valuable insights into your site’s performance.
Improving First Input Delay (FID)
Making your site more interactive is all about improving First Input Delay. Here’s how you can do that:
Understanding INP Components
INP has three phases:
- Input Delay – the time from when the user interacts to when the event handler starts
- Processing Time – the time it takes to run the event handlers
- Presentation Delay – the time to paint the next frame after processing
Break Up Long Tasks
JavaScript execution that blocks the main thread for more than 50ms is what we call “long tasks” and they delay interactions. Break these up using:
- setTimeout() to let the browser get back to normal
- requestIdleCallback() for non-urgent work
- scheduler.yield() in modern browsers for more control
- Code splitting to only load the necessary JavaScript
JavaScript Execution: JavaScript is often the reason behind slow user interaction. Minimising and deferring JavaScript can cut execution time by a lot. Tools like Webpack can help bundle and minify your JS files, which reduces unnecessary JavaScript and improves page performance.Optimise Event Handlers: Making event handlers lean and efficient is key:
- Ditch the rush by debouncing or throttling rapid events (like scroll, resize or typing)
- Use passive event listeners wherever you can : addEventListener(‘scroll’, handler, {passive: true})
- Try to avoid heavy DOM manipulating in your event handlers
- Move complex calculations to Web Workers so your main thread stays clear
Browser Rendering: Fine-tuning the critical rendering path to get content on screen as fast as possible is what it’s all about. By prioritising critical resources and putting non-essential scripts on hold, browsers can focus on loading the content that matters most to users.
Third-Party Scripts: While they add a ton of cool features, these scripts can slow your site down. Loading them in the background so they don’t block the main content from loading is a good step. Even better, defer third-party scripts until after user interaction or use Partytown to run them in Web Workers, keeping your main thread free.[5]
Audit Your Third-Party Impact:
- Get rid of third-party scripts you don’t need
- Delay analytics and chat widgets until after page load
- Use facade patterns for heavy embeds (like YouTube, maps)
- Use Chrome DevTools Performance tab to keep an eye on third-party script execution time
By following these strategies, you can make sure your website stays responsive to user actions, and that’s a big win for the user experience and potentially even boosts engagement and conversions. Keeping an eye on your core web vitals regularly is what’ll get you there.
Reducing Cumulative Layout Shift (CLS)
Keeping your site’s visuals stable is what CLS is all about, and reducing it is key for a smooth user experience. Here’s how you can tackle it:
- Size Attributes for Images and Videos: Always set dimensions for images and videos in your HTML. This stops sudden shifts by reserving space on the page, making sure content doesn’t unexpectedly move around as it loads. By doing so, you’re enhancing the visual stability and making sure your site feels nice and solid.
- Ads and Embeds: Dynamic content like ads can cause layout jumps. Setting aside space for these elements and using CSS to define dimensions can prevent such hiccups.
- Web Fonts: Loading web fonts can lead to invisible text or layout shifts. Using font-display: swap in your CSS ensures that a fallback font is shown until the custom font loads, keeping text visible and layouts stable.
By addressing these areas, you can offer a stable visual experience, reducing user frustration and boosting retention. Regularly checking your core web vitals metrics can help identify any layout shifts that need attention.
Tools and Techniques for Measurement
To keep tabs on and improve Core Web Vitals, using the right tools is crucial. Here are some top picks for measuring these metrics:
- Google PageSpeed Insights: This tool gives a detailed breakdown of your site’s performance, offering specific tips for improvement. It checks both mobile and desktop performance, providing insights into LCP, FID, and CLS. PageSpeed Insights is your go-to for understanding core web vitals and implementing performance optimisations.
- Lighthouse: An open-source tool, Lighthouse provides insights into various aspects of web performance, including accessibility and SEO. It offers a comprehensive report to guide your optimisation efforts.
- Search Console: Google’s Search Console features a Core Web Vitals report that tracks your pages’ performance. It highlights pages needing a boost and offers insights into how to optimise them. Regularly reviewing this report can help you measure core web vitals data effectively.
Using these tools will not only help pinpoint improvement areas but also track progress over time, ensuring your website consistently meets Google’s high standards. Moreover, leveraging Chrome User Experience Report (CrUX data) can provide additional field data insights for your site’s performance.
WordPress-Specific Optimisations
Since many businesses use WordPress, here are platform-specific tips to improve Core Web Vitals:
Recommended Performance Plugins
- WP Rocket – Comprehensive caching and optimisation
- Perfmatters – Script management and performance tweaks
- ShortPixel or Imagify – Automatic image optimisation including AVIF conversion
- Asset CleanUp – Disable unnecessary scripts on specific pages
Measuring Success: The 75th Percentile Rule
Understanding how Google measures Core Web Vitals is critical. Google doesn’t use averages – it uses the 75th percentile of all page visits over a 28-day period [8]. This means:
- You need sufficient traffic for CrUX inclusion (min. threshold applies)
- Focus on consistency, not just peak performance
- One bad experience affects your score less than consistent poor performance
- Both origin-level and URL-level data matter
Origin-level data affects your entire domain’s ranking potential, while URL-level data can impact individual pages.
Summary and Key Takeaways
Boosting your Core Web Vitals is a huge step forward in delivering a seamless experience that really meets the expectations of your users and of search engines too. By zooming in on these key metrics your business can rest assured that your websites delivering the goods that your customers and search engines alike are looking for.
Here are the key takeaways:
- Largest Contentful Paint (LCP)
- Sort out your images and try using formats like WebP – it will cut your load times in half for sure.
- Use a Content Delivery Network (CDN) to make your server respond faster.
- Tidy up those non-essential resources, minify and defer them to speed things up.
- First Input Delay (FID)
- Cut down on that JavaScript and try deferring it to speed up interactivity.
- Make sure your content is rendering as fast as possible – tweak that critical path and you’ll be good to go.
- Load those third-party scripts up in the background and avoid blocking everything up.
- Cumulative Layout Shift (CLS)
- Give your images and videos a size, to keep the layout stable while they load.
- Make sure you’re reserving space for dynamic content like ads – the last thing you want is for the page to shift all over the place.
- If you’re using fonts – try font-display: swap and keep the text visible while the font loads up.
Closing Thoughts
Improving your website’s Core Web Vitals is a bit more than just a technical exercise – it’s a whole strategic shift that can lift your whole online presence. By focusing on sorting out LCP, FID, and CLS you’re creating a far more engaging and stable experience that people and search engines alike will really appreciate. As you start making these improvements, don’t forget that Dandy is here to help you on your journey.
We’ve got some pretty comprehensive SEO services that help businesses like yours thrive in the digital world. With a dedicated team, solutions tailored just to you, clear reporting, and no long-term commitments – Dandy is there to make sure your website is not only up to scratch but exceeding expectations.
FAQs
How do Core Web Vitals affect page experience and rankings?
Core Web Vitals are now a confirmed ranking factor in Google’s algorithm. They measure key aspects of page experience such as how quickly web pages load, how smooth the first user interaction feels, and how stable content appears during loading. Optimising these vitals helps pages load faster, making a strong impact on both user satisfaction and SEO performance.
What tools can help monitor and measure loading performance?
You can use Google’s Chrome User Experience Report (CrUX) to analyse real-world metrics from actual visitors and see how your site performs on LCP, FID, and CLS. Tools like PageSpeed Insights or Lighthouse also measure loading performance and identify any resource load delays affecting your site’s load speed. Combining lab data and field data ensures a complete view of user experience.
How can I fix slow load times and improve Core Web Vitals?
To solve slow load times, start by enabling lazy loading for images and videos so they only appear when users scroll to them. Minify code, cache static assets, and remove unnecessary scripts that cause resource load delay. These optimisations help your site load faster, reduce main-thread blocking, and create a snappier experience for every first user interaction.

The Ultimate SEO Audit Checklist for 2026
February 12, 2026
How To Start a Blog For Your Business
January 23, 2026
How to Measure SEO Success Effectively
January 16, 2026